SP Chart Analysis(Pro)

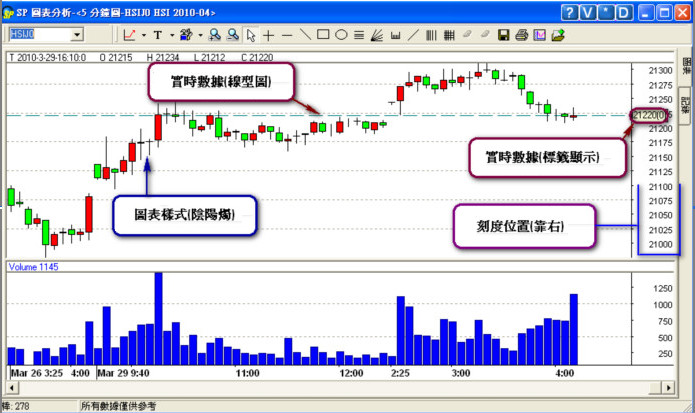
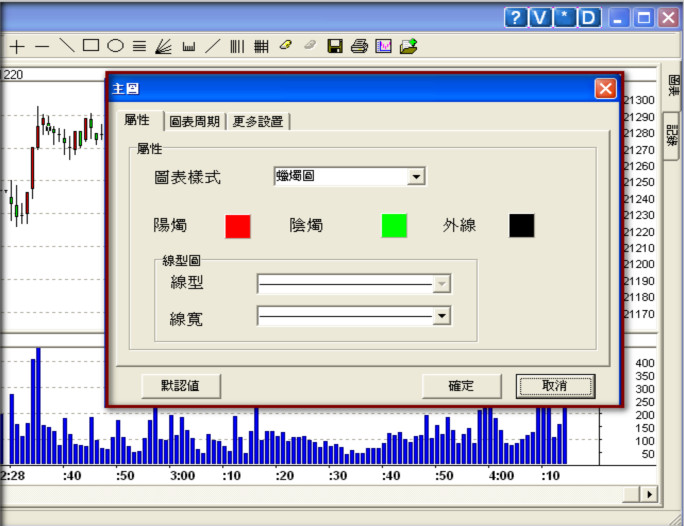
User can set the chart style including “chart style”, “scale type”, “ticker display”.
Through “Chart style” user can select to display the chart as“Candle Stick”, “Bars” or “Line”.
“Scale Type” is to set the scale display on the right, left or both sides.
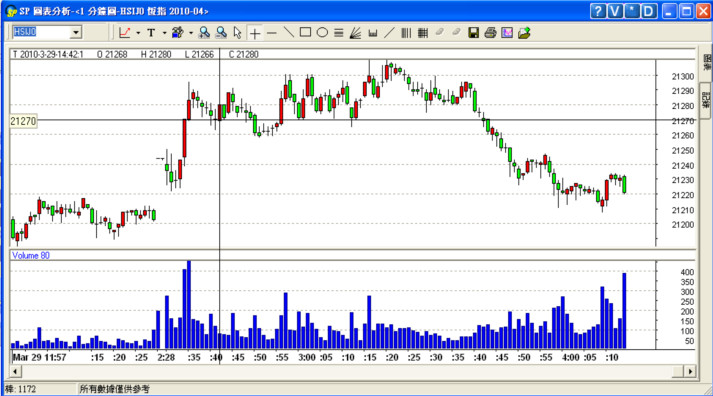
“Ticker Display”can choose “Label” or “Line” format to display the latest last price. “Label” will display the last price on the scale, while “Line” will indicate the last price by a line.
Following please find the sample for chart style setting:

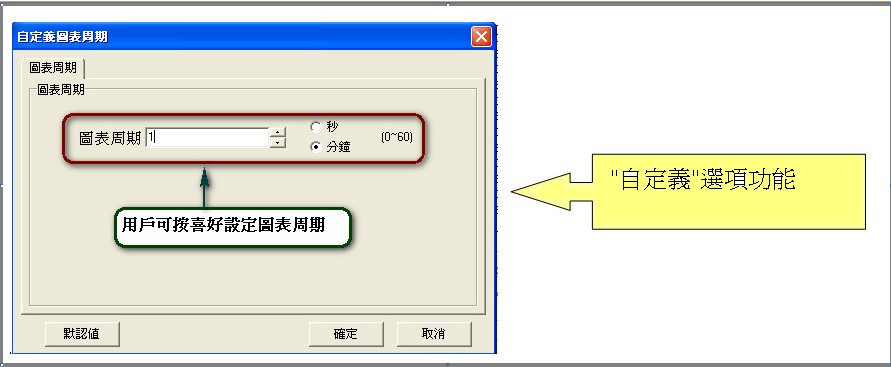
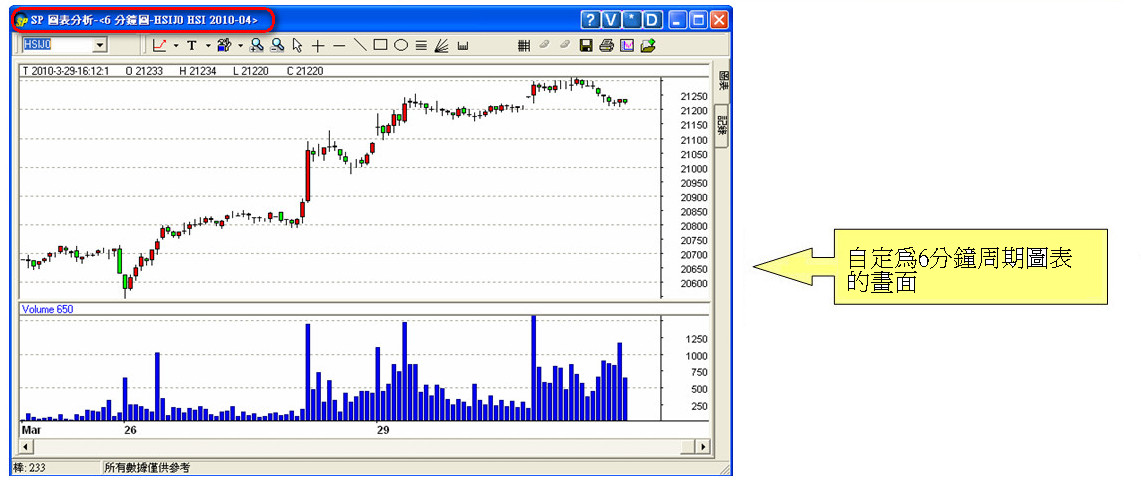
User can freely control the chart period. Apart from the 6 types of default chart periods, user can also customize to display chart ranging from “seconds” to “Mins” format.
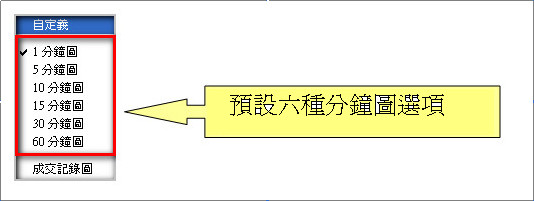
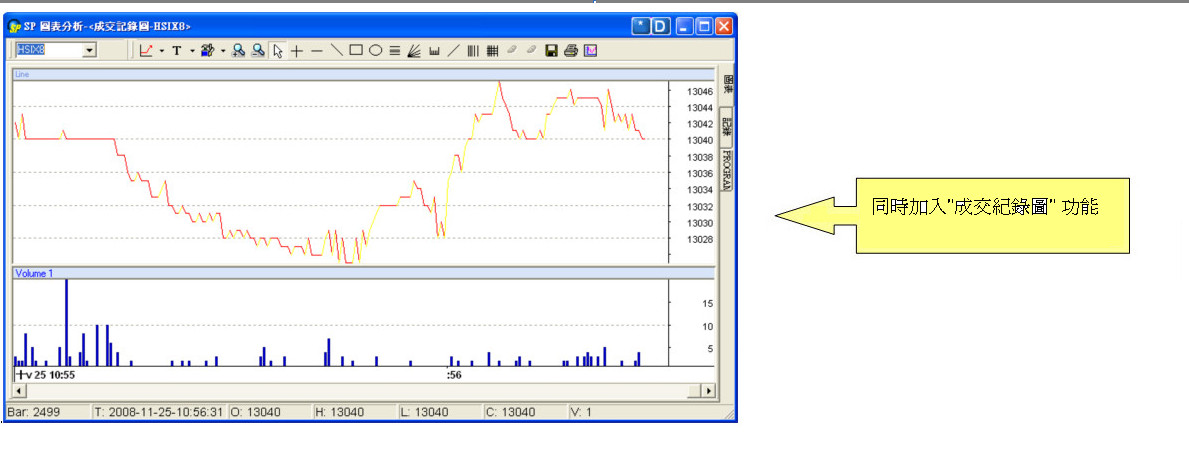
The ticker chart is also kept which can display up to 2500 ticker informations.

More than 10 types of analysis tools commonly used in market can be selected.
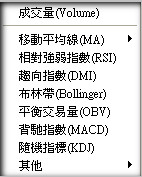
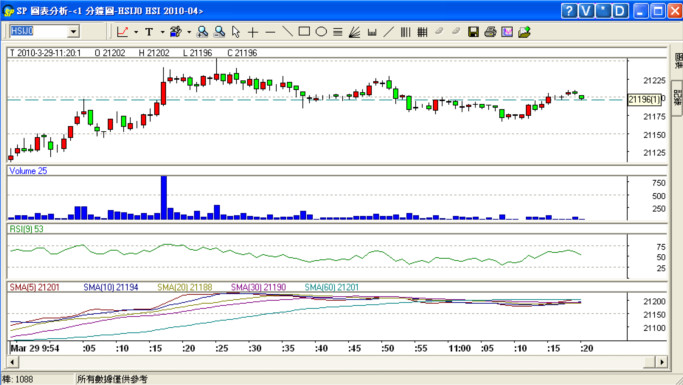
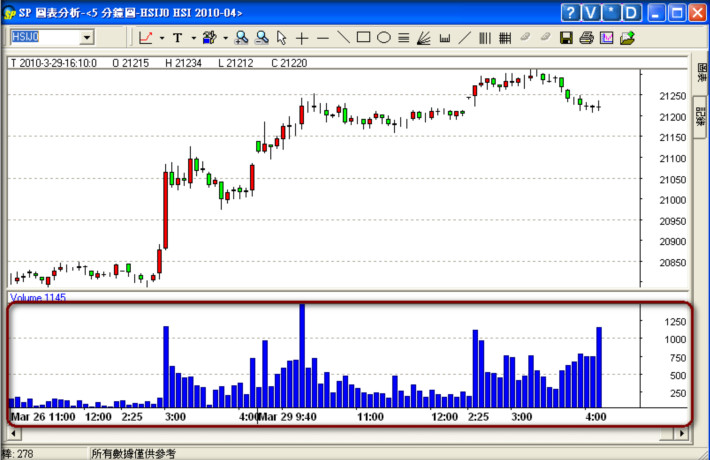
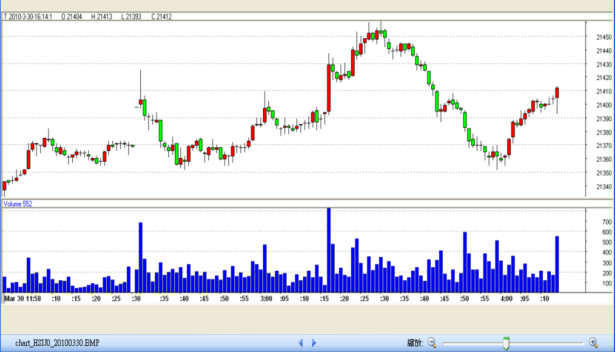
Volume: Indicator default displayed on Professional chart. User can change the colour and line type.
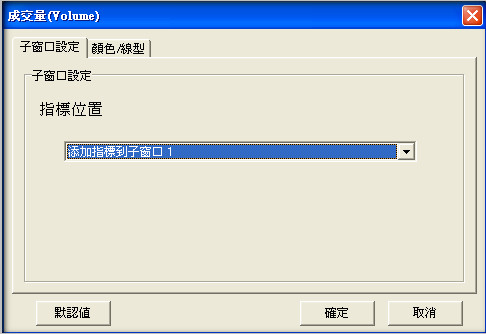
The total volume displayed varies with the chart period setting. For example, total volume for every 5 minutes will be displayed in bar if the chart period is set as “5 Mins”.
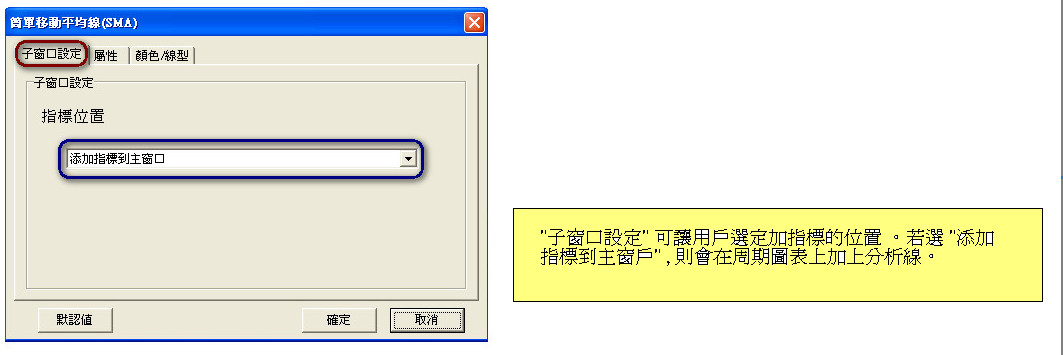
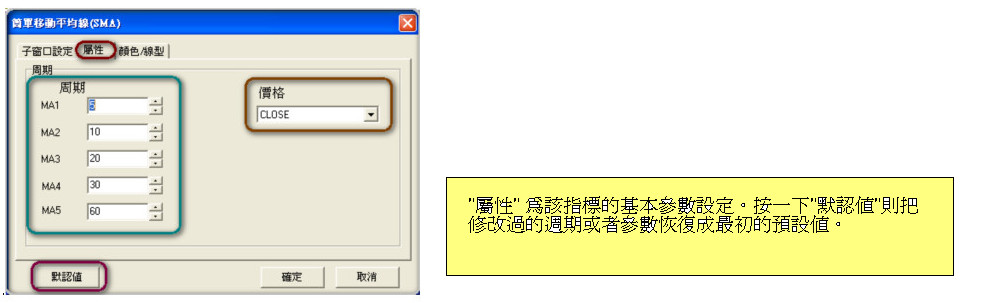
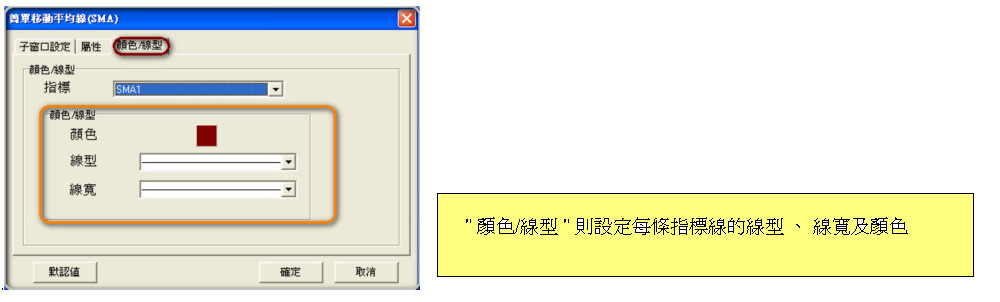
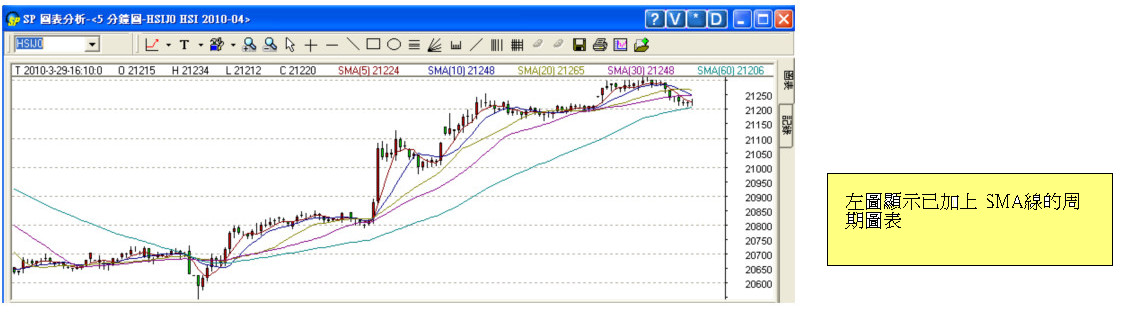
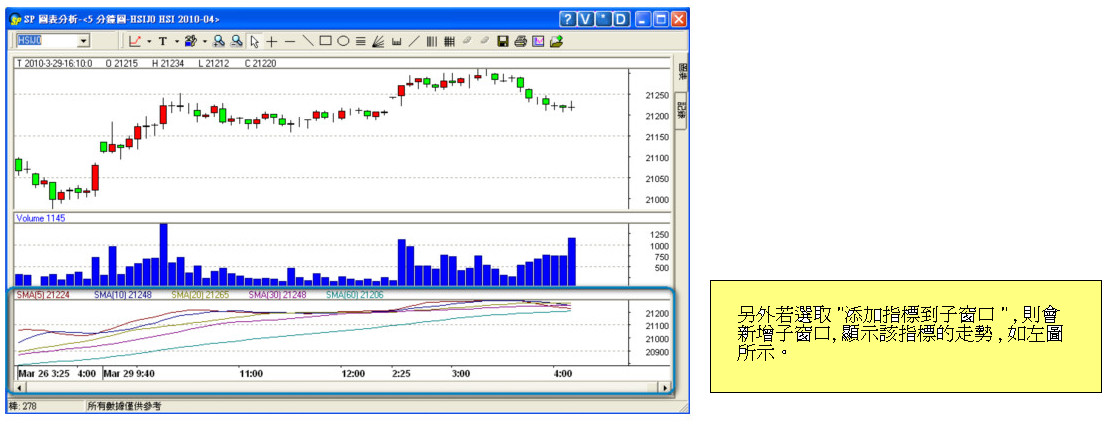
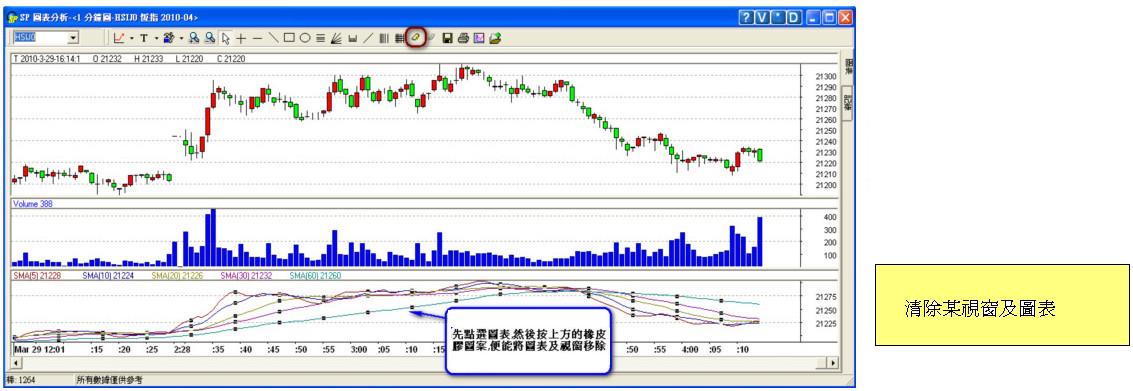
Varies choice of analysis tools can be chosen besides the “Volume” indicator, e.g. MA, RSI, MACD, etc. Users can select the suitable type of tools, set the property and colour/line type and display it in Main window or Sub window. Following demonstrates the addition of SMA on the chart:

pic1
pic2
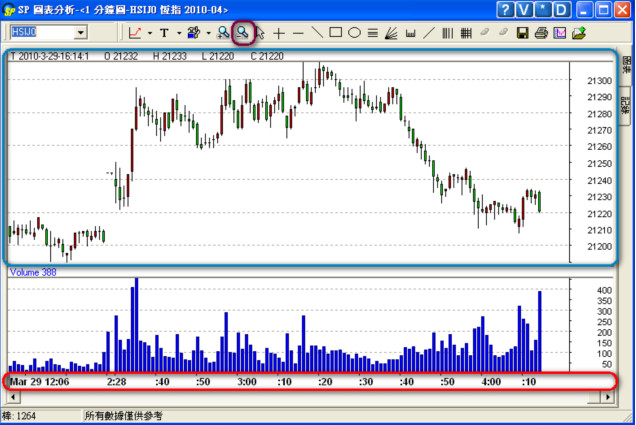
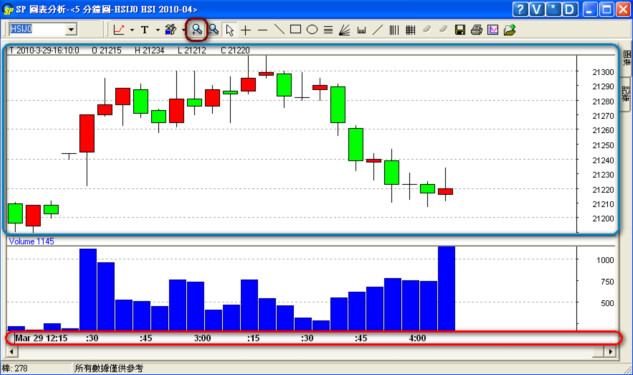
Through “Zoom in” (pic1) and “Zoom out” (pic2) functions, user can adjust the period and data depth to be viewed.

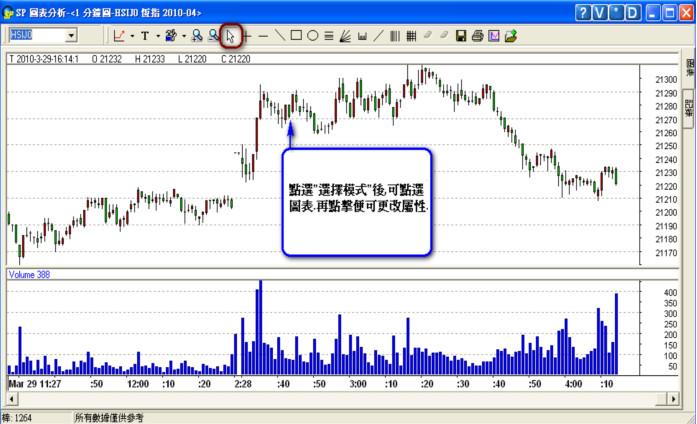
After clicking “select mode”, user can click the chart(pic3) and change the property(pic4).

“Crosshairs” is used to show the details (price and quantity, etc) of a particular point on the candle stick.
pic5

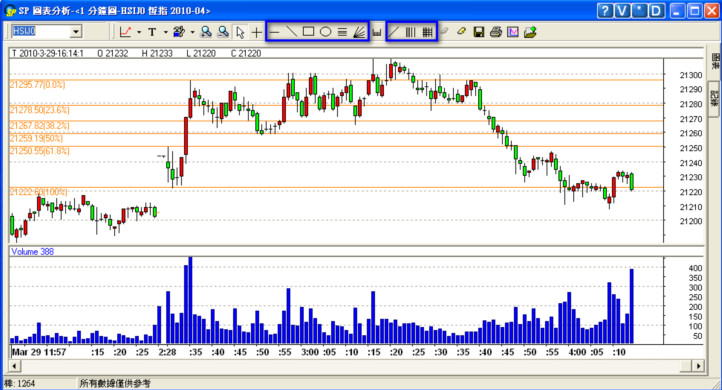
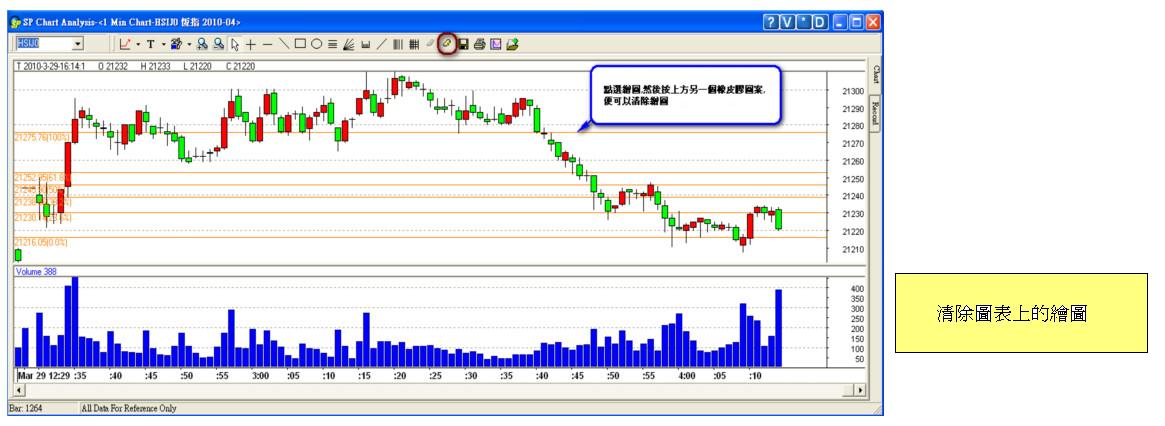
Several drawing tools can be used to plot the analysis diagram.
pic6

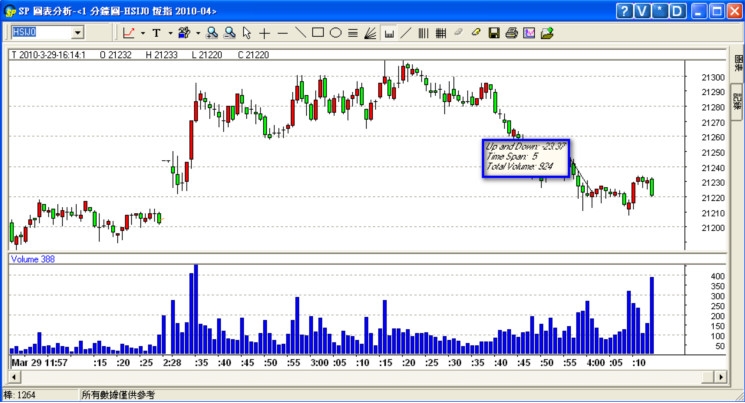
“Ruler” is to determine the “Up/Down” , “Time Span” and “Total Volume” between 2 levels on the candle sticks.


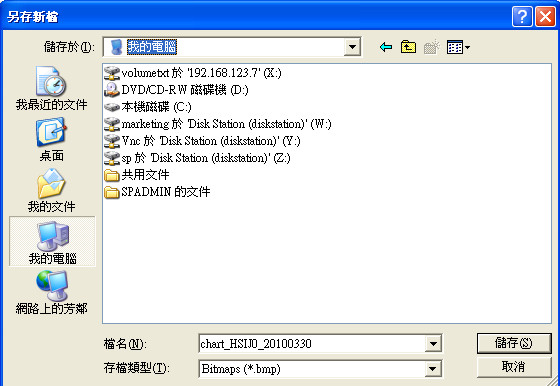
“Save Chart” allows users to save their chart as Bmp file format for record keeping.

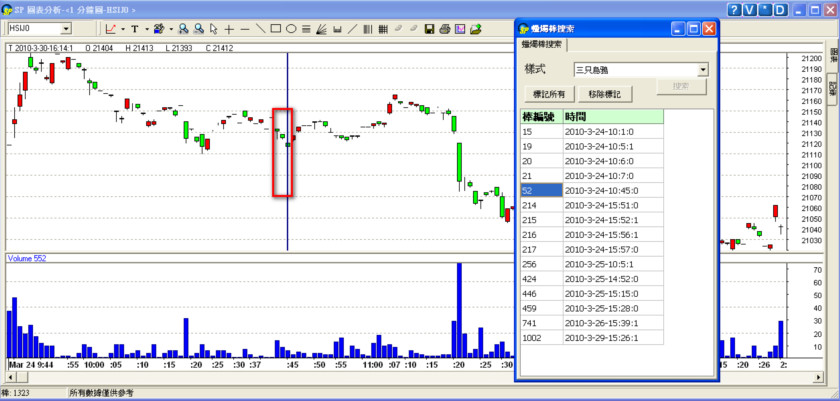
Different Candle stick combinations can be easily found in our chart, which can be used to predict the trend of the market.

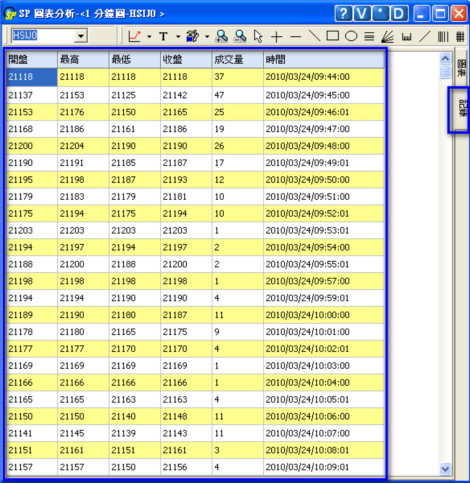
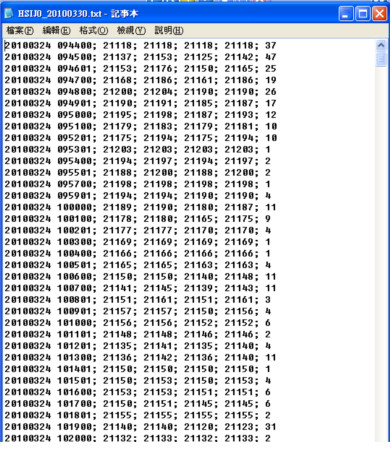
The “Record” function(displayed on the top right hand side of chart) can be used to view the market history(i.e. “Open”, “High”, “Low”, “Close”, “Volume” and “Time”) .These details varies according to the chart period set.
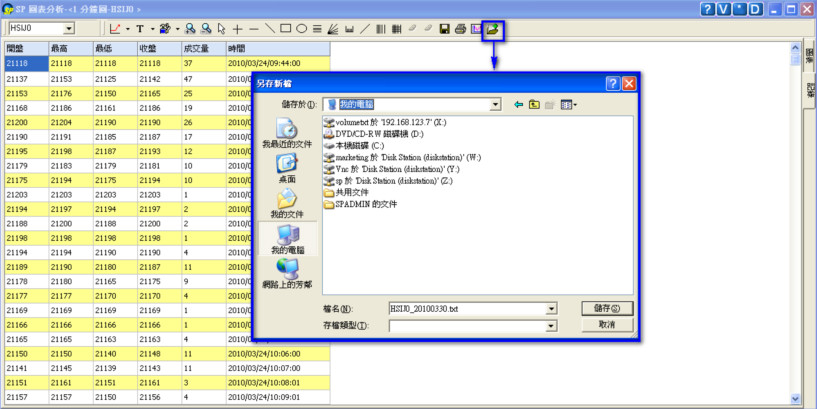
User can backup the “record” information in TXT format through “Save Record”function.