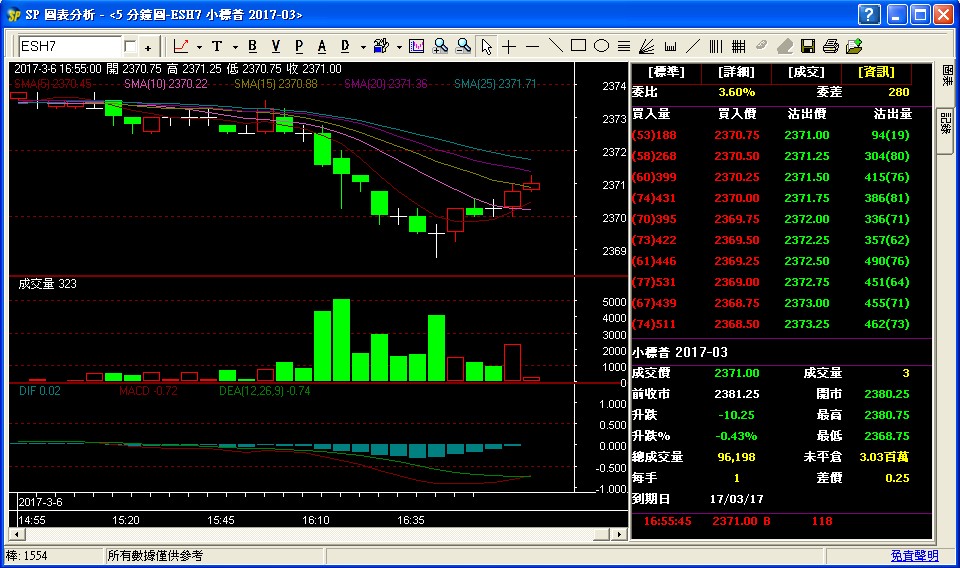
SP Chart Analysis (Pro)
You can open the SP Chart Analysis (Pro) Window from the Trades Menu.
[F5]Switch between 【min Chart】and【time-sharing Chart】
[F6] Switch between showing Bid / Ask queue or not showing
[F7] Show shorter period chart
[F8] Show longer period chart
[←] time moves forwards
[→] time moves backwards
[↓] shows more data in time
[↑] shows less data in time
The functions are as below,
Click the【Chart Style】icon, , and there are choices as below -
Click the【Chart Period】icon, can select 5-second, half-minute, 1, 10, 15, 30 or 60-minute chart, 【Time-sharing】or 【Customerized Chart Period】 with second or minute as chart unit.
1. Click , the background for the chart will be switched between BLACK and WHITE.
2. Click , can choose show, or not to show VOLUME on the chart.
3. Click , can choose show, or not to show the POSITION.
4. Click , user can select 【User-default canvas】,【Save user-def canvas】or【Recover System def canvas】so that the properties of the chart will be set back to default, and all the drawings are removed.
5. Click , can choose to show, or not to show PRICE in the right hand side of the chart.
There are 4 choices within the 【Show Price】column -
1. Click【S】, will show PRICE DEPTH (vertically) and last executed trades.
Right-click the mouse, user can choose 【Auto】,【5 Levels】 or 【10 Levels】 for the PRICE DEPTH.
For the display format of price depth, from the left to the right is,
Description : Bid/Ask price : Bid/Ask quantity(Number of buy/sell orders are shown within the brackets *) : Accumulated bid/ask quantity
* depends on if it is supported by the Exchanges
【C】= Previous closing price
【O】= Opening price
【H】= High price
【L】= Low price
BS%=(Buy size - Sell size)/(Buy size + Sell size)×100%
When BS% = -100%, it means only SELL but no BUY in the market.
When BS% = +100%, it means only BUY but no SELL in the market.
When BS% = 0%, it means BUY size = SELL size。
B-S=Total BUY - Total SELL, which reflects their respective powers. + sign means BUY side stronger, while - sign mean SELL side stronger.
In the Product Info, the color of data will vary according to the following rules,
RED, when market price > close price
GREEN, when market price < close price
BLACK/WHITE=default color, when market price = close price
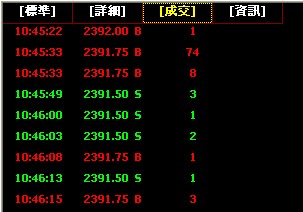
【 B】means Buy, hit ask queue
【 S】mean Sell, hit bid queue
no symbol means unknown
New version supports these markings, please ask your broker for details.
Trade source * - shows the trader remark
* depends on if it is supported by the Exchanges
Valid trade remarks are as below:
BB - Bulletin Board Orders
STDC - Standard Combination Orders
INT - Block Trades
AUC - Auction Orders
MPS - Deal Registration
If there is 【*】sign in front of the ticker time, it mean it is your own trade.
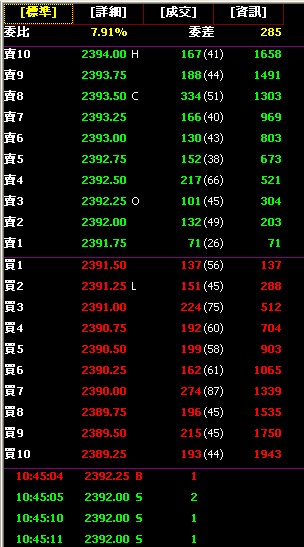
2. Click【D】, will show PRICE DEPTH of 5 or 10 levels (vertically), product info and last executed trades.
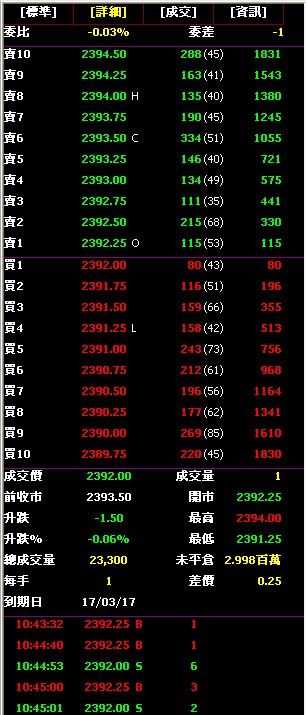
For the display format of price depth, from the left to the right is,
Description : Bid/Ask price : Bid/Ask quantity(Number of buy/sell orders are shown within the brackets *) : Accumulated bid/ask quantity
* depends on if it is supported by the Exchanges
3. Click【T】, will show TRADE.
4. Click【I】, will show PRICE DEPTH (horizontally), product info, includes “high”, “low”, “open”, “close”, “volume”, etc., and the last executed trades
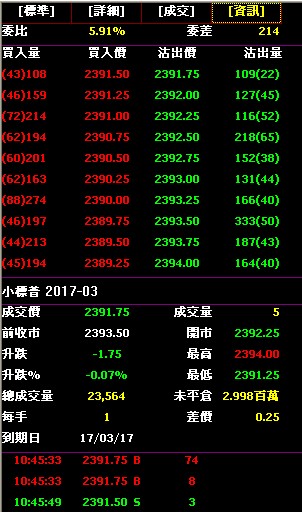
For the display format of price depth, from the left to the right is,
(Number of buy/sell orders are shown within the brackets * ) Quantity of Bid : Bid price: Ask price : Quantity of Ask (Number of buy/sell orders are shown within the brackets * )
* depends on if it is supported by the Exchanges
User can choose different indicators.
1.【Volume】indicator is set as default, and user can change【Sub-window setting】and【Color】, etc., according to own preference.
2. User can also use the other indictors, e.g., Moving Average(MA), RSI, MACD, etc. Then it will be showed after confirming the properties like color and line type.
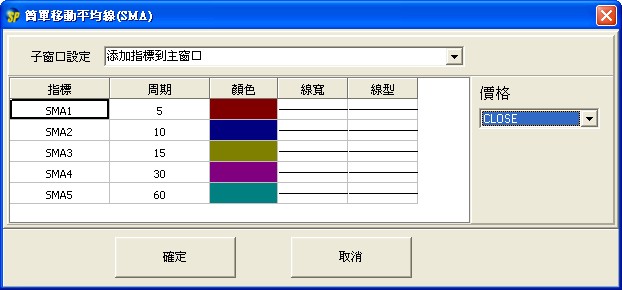
Take Simple MA as an example:
By clicking 【Candlestick Detection】 icon, user can search different candlestick patterns via 【Pattern】 to help the user to see the market trend.
By clicking the left 【Zoom in】 or the right【Zoom out】icons, or using the mousewheel, or the up and down arrow keys in the keyboard, user can adjust the period and data depth to be viewed.
After clicking “Select Mode”, user can double-click the style on the chart to change its property.
After clicking the【Crosshairs】icon, user can see the data, e.g. price and time, etc., of the point chosen on the chart.
Various drawing tools can be used to plot the tailor-made analysis diagram.
“Ruler” is used to determine the difference between 2 points on the chart, e.g., the “Up/Down” , “Time Span” and “Total Volume”.
1. By clicking the left【Eraser】icon, user can remove the selected line.
1. By clicking the right【Eraser】icon, user can 【Remove all lines】.
“Save Chart”icon allows users to save their chart in BMP file format.
By clicking the 【Save Record】icon, user can save the data in TXT format.
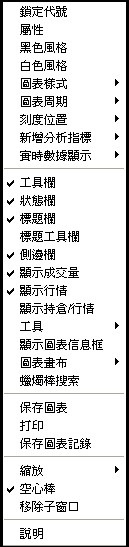
Right-click the mouse, a menu will pop-up as shown below with different choices -
[F5]Switch between 【min Chart】and【time-sharing Chart】
[F6] Switch between showing Bid / Ask queue or not showing
[F7] Show shorter period chart
[F8] Show longer period chart
[←] time moves forwards
[→] time moves backwards
[↓] shows more data in time
[↑] shows less data in time
The functions are as below,
Click the【Chart Style】icon, , and there are choices as below -
- 【Chart style】 - user can choose【Candlestick】, 【Bars】 or 【Line】
- 【Scale Type】- user can choose 【Scale Left】,【Scale Right】or【Scale Both】.
- 【Label】 - user can choose to show, or not to show the last traded price on the scale, while the number inside the brackets is the last traded quantity of the last traded price.
- 【Ticker Line】- user can choose to show, or not to show by selecting【Ticker show】, and user can change the Color/Line Type by selecting 【Property】.
- 【Show Day Line】 - user can choose to show, or not to show.
Click the【Chart Period】icon, can select 5-second, half-minute, 1, 10, 15, 30 or 60-minute chart, 【Time-sharing】or 【Customerized Chart Period】 with second or minute as chart unit.
1. Click
, the background for the chart will be switched between BLACK and WHITE. 2. Click
, can choose show, or not to show VOLUME on the chart.3. Click
, can choose show, or not to show the POSITION. 4. Click
, user can select 【User-default canvas】,【Save user-def canvas】or【Recover System def canvas】so that the properties of the chart will be set back to default, and all the drawings are removed. 5. Click
, can choose to show, or not to show PRICE in the right hand side of the chart. There are 4 choices within the 【Show Price】column -
1. Click【S】, will show PRICE DEPTH (vertically) and last executed trades.
Right-click the mouse, user can choose 【Auto】,【5 Levels】 or 【10 Levels】 for the PRICE DEPTH.
For the display format of price depth, from the left to the right is,
Description : Bid/Ask price : Bid/Ask quantity(Number of buy/sell orders are shown within the brackets *) : Accumulated bid/ask quantity
* depends on if it is supported by the Exchanges
【C】= Previous closing price
【O】= Opening price
【H】= High price
【L】= Low price
BS%=(Buy size - Sell size)/(Buy size + Sell size)×100%
When BS% = -100%, it means only SELL but no BUY in the market.
When BS% = +100%, it means only BUY but no SELL in the market.
When BS% = 0%, it means BUY size = SELL size。
B-S=Total BUY - Total SELL, which reflects their respective powers. + sign means BUY side stronger, while - sign mean SELL side stronger.
In the Product Info, the color of data will vary according to the following rules,
RED, when market price > close price
GREEN, when market price < close price
BLACK/WHITE=default color, when market price = close price
【 B】means Buy, hit ask queue
【 S】mean Sell, hit bid queue
no symbol means unknown
New version supports these markings, please ask your broker for details.
Trade source * - shows the trader remark
* depends on if it is supported by the Exchanges
Valid trade remarks are as below:
BB - Bulletin Board Orders
STDC - Standard Combination Orders
INT - Block Trades
AUC - Auction Orders
MPS - Deal Registration
If there is 【*】sign in front of the ticker time, it mean it is your own trade.
2. Click【D】, will show PRICE DEPTH of 5 or 10 levels (vertically), product info and last executed trades.
For the display format of price depth, from the left to the right is,
Description : Bid/Ask price : Bid/Ask quantity(Number of buy/sell orders are shown within the brackets *) : Accumulated bid/ask quantity
* depends on if it is supported by the Exchanges
3. Click【T】, will show TRADE.
4. Click【I】, will show PRICE DEPTH (horizontally), product info, includes “high”, “low”, “open”, “close”, “volume”, etc., and the last executed trades
For the display format of price depth, from the left to the right is,
(Number of buy/sell orders are shown within the brackets * ) Quantity of Bid : Bid price: Ask price : Quantity of Ask (Number of buy/sell orders are shown within the brackets * )
* depends on if it is supported by the Exchanges
User can choose different indicators.
1.【Volume】indicator is set as default, and user can change【Sub-window setting】and【Color】, etc., according to own preference.
2. User can also use the other indictors, e.g., Moving Average(MA), RSI, MACD, etc. Then it will be showed after confirming the properties like color and line type.
Take Simple MA as an example:
- 【Sub-window setting】let user to choose where to place the indicator. If user chooses“Add indicator to main window”, it will be place in the main chart; if user chooses“Add indicator to sub-window”, then new sub-window will be added to show this indicator.
- User can change the parameters of each indicators, e.g, period, color, line width and line type, etc.
By clicking 【Candlestick Detection】 icon, user can search different candlestick patterns via 【Pattern】 to help the user to see the market trend.
By clicking the left 【Zoom in】 or the right【Zoom out】icons, or using the mousewheel, or the up and down arrow keys in the keyboard, user can adjust the period and data depth to be viewed.
After clicking “Select Mode”, user can double-click the style on the chart to change its property.
After clicking the【Crosshairs】icon, user can see the data, e.g. price and time, etc., of the point chosen on the chart.
Various drawing tools can be used to plot the tailor-made analysis diagram.
“Ruler” is used to determine the difference between 2 points on the chart, e.g., the “Up/Down” , “Time Span” and “Total Volume”.
1. By clicking the left【Eraser】icon, user can remove the selected line.
1. By clicking the right【Eraser】icon, user can 【Remove all lines】.
“Save Chart”icon allows users to save their chart in BMP file format.
- By clicking the“Record”tab in the right hand side, user can view the market history (i.e. “Open”, “High”, “Low”, “Close”, “Volume” and “Time”) . The data from the record varies based on the chart period, e.g., data below is shown in 1-minute period.
Right-click the mouse, a menu will pop-up as shown below with different choices -